User interfaces (UIs) are an essential part of modern software applications, providing an interactive way for users to interact with the underlying functionality of the application. Qt Creator, a popular integrated development environment (IDE) for developing Qt applications, provides a graphical interface for designing UIs using a drag-and-drop approach. Once the UI is designed, we can implement it in Python using the PySide2 library, which is a set of Python bindings for the Qt application framework. HMI is Human Machine Interface – The hardware or software through which an operator interacts with a controller. In this blog, we will explore how to design HMI on Brainy Pi using Python i.e. UI with Qt Creator and implement it in using PySide2.
Index
Pre-requisites
HMI Top-level Design
QT Creator Overview
Designing the HMI in Depth
Coding
Run the ready to use code
TLDR
Pre-requisites for HMI on Brainy Pi
Installing Qt creator
Installing PySide2 (python for QT5)
Installing pyqtgraph (library for creating graphs)
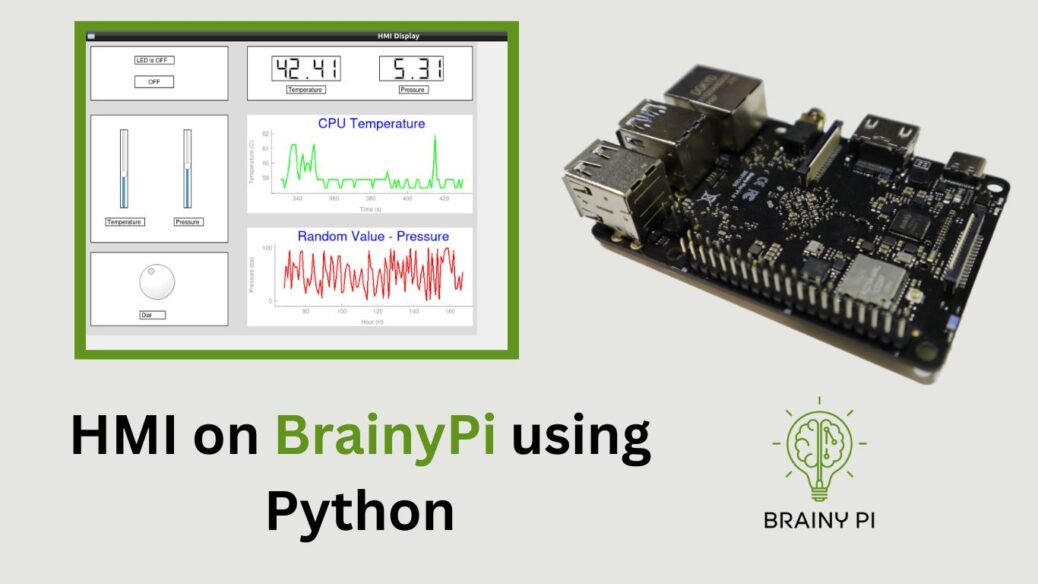
HMI Top-level Design
PushButton which will toggle a GPIO on or off and show the GPIO value.
2 LCD display, 1 Displays Temperature, 1 Displays Pressure
2 Sliders
1 Slider for setting Temperature
1 Slider for setting Pressure
Dial for fine tuning the temperature setting.
2 Graphs
1 Graph which displays live CPU temperature of the system.
1 Graph which displays a random value.
Finally the HMI would look something like this.

QT Creator Overview
Designing a UI with Qt Creator involves the following steps:
Open QT Creator

Create a New Qt Project: Launch Qt Creator and create a new Qt project by selecting “File” > “New File or Project” from the menu bar.
Choose “Application (QT for Python)” as the project template, then choose the “QT for Python – Window (UI file)” as the template and click “Next”.
To Configure the Project: Enter a Class name for the project, and then click “Next”.
Finally, click “Finish” to create the project.
Design the UI:
Once we create a project, Qt Creator will open the main window so click on the
form.uito open the Designer windowThe main window consists of a central widget, where the UI can be designed using various UI elements such as buttons, labels, text boxes, etc., which can be dragged and dropped onto the canvas and hence it becomes easy for developers to create UI using QT.


The properties of each UI element can be customized using the “Properties” pane on the right side of the window.
We will see the designing the HMI in depth in next section.
Save the UI: After making changes to the UI, save by selecting “File” > “Save” from the menu bar.
Designing the HMI on Brainy Pi in Depth
Since, we got basic understand of QT Creator lets move on to designing HMI for our application. Double click on the “form.ui” file in QT Creator, to open up the QT Designer window, this is where we will be designing the UI.

1. Button and Labels
Search for PushButton, Drag and drop it into the canvas.
So now double Click on the PushButton to change the text inside the PushButton, to
OFF.Search for Label, Drag and drop it into the canvas, just above the PushButton.
So now double Click on the Label to change the text inside the label.


2. Sliders, Dials and LCD
Search for Vertical Slider, Drag and drop it into the canvas. Make it 2 vertical sliders.
Then search for Dial, Drag and drop it into the canvas.
Then search for LCD Number, Drag and drop 2 LCD into the canvas.
Label all the components that you dropped into the canvas and the end result should look like this


3. Graphs
Search for Widget, Drag and drop 2 widgets into the canvas.
Then resize both the widget as per your liking.
Note Down the Width and the Height of the widgets from the Properties section.


Coding
Implementing the UI designed with Qt Creator in Python using PySide2, will the split into these parts
1. Structure of the code
Class Definition: The
hmiclass is defined, which inherits from theQWidgetclass, the base class for all GUI objects in PySide2. Thehmiclass represents the main window of the GUI and contains methods for initializing GUI widgets, handling signals and slots, and updating GUI elements.GUI Layout: The
load_uimethod loads the GUI layout from an external.uifile using theQUiLoaderclass. The.uifile contains the graphical design of the GUI created using Qt Creator.Application Definition: We used
QApplicationclass to create application, and usedhmiclass to create new window and this window is the primary window of the application.
2. Button and Labels
We will create a
init_uifunction to initialize the UI.We will also create a
init_gpiofunction to initialize the GPIO which will be toggled by the button.Then we will create a function
gpio_togglewhich will toggle GPIO on or off on button pressThe @Slot() decorator indicates that this method is a slot, which can be connected to signals emitted by GUI widgets.
The method first checks the current state of the LED, which is stored in a boolean variable self.LED_value.
If the LED is currently ON (self.LED_value is True), the method turns it OFF by setting the GPIO pin to GPIO.LOW, updating the button text to “OFF”, and changing a label text to “LED is OFF”.
If the LED is currently OFF (self.LED_value is False), the method turns it ON by setting the GPIO pin to GPIO.HIGH, updating the button text to “ON”, and changing the label text to “LED is ON”.
Connect the
gpio_togglefunction to button click using the button click signal
3. Sliders, Dials and LCD
Lets create a function for updating the LCD Display when the slider is moved.
slider1Moved(self, value): This method is a slot that is connected to a slider widget in the GUI. It is triggered when the slider is moved, and it updates the value displayed on an LCD widget. The value is calculated by taking the slider value (value) divided by 10, then taking the modulus of 20, and adding 0.01. The result is then displayed on the LCD widget using the display() method.
slider2Moved(self, value): Similar to slider1Moved, this method is a slot connected to a second slider widget. It updates the value displayed on a different LCD widget. We calculate this value by adding 0.01 to the slider value, and then displayed on the LCD widget using the display() method.
Let’s create a function for updating the LCD Display when the Dial is moved, the code is similar to the slider
dialMoved(self, value): This method is a slot connected to a dial widget. It updates the value displayed on the same LCD widget as slider2Moved. The value is calculated by adding the dial value divided by 100 to a variable self.TEMP_value, and then displayed on the LCD widget using the display() method.
Now Let’s connect all the above functions to their respective UI elements, so that when the user interacts with those UI elements, those function get triggered.
Hence, this is how
init_uifunction connects the UI elements and functions.
4. Graphs
To create 2 Graphs, we need these functions for each graph
Initialize function – Which initializes the Graph
Timer function – Which triggers the update function after set time.
Update Function – Which updates the Graph values
Now that we understood what these functions are let’s create the Initialize function
Both these functions:
Creates a PlotWidget object from pyqtgraph library to create a graph in the GUI.
Sets properties of the graph such as background color, title, axis labels, and size.
Creates lists to store x and y values of the graph and fills these list with initial values
Creates a plot on the graph using the plot() method with the specified pen.
Let’s create and update function
update_graph1_data(self): Updates the data of Graph1 by removing the oldest data point, adding a new data point for CPU temperature obtained from get_cpu_temperature() function, and updating the plot with the new data using setData() method.
update_graph2_data(self): Updates the data of Graph2 by removing the oldest data point, adding a new random data point, and updating the plot with the new data using setData() method.
get_cpu_temperature(self): Helper function that reads the live system CPU temperature from a file, converts it to Celsius, and returns the temperature as a float value.
Let’s move on to create the Timer functions
initialize_timer_for_graph1(self, updateTime, updateFunction): Initializes a timer for Graph1 with the given time interval updateTime in milliseconds. The timer is connected to the updateFunction which is responsible for updating the data of Graph1. The timer is started using start() method.
initialize_timer_for_graph2(self, updateTime, updateFunction): Initializes a timer for Graph2 with the given time interval updateTime in milliseconds. The timer is connected to the updateFunction which is responsible for updating the data of Graph2. The timer is started using start() method.
Now that we explored all the factors lets put it all together
This is how we initialize the graphs and set the timer in the
init_uifunction.Now the code should be ready
Your code should look something like this – https://github.com/brainypi/brainypi-hmi-example.git
Run the ready to use code
Open Terminal and Navigate to your project folder
Then run the program


