Grafana is an open source software that helps you monitor your system through interactive visualisation web application using graphs and charts. It’s open source and lets you see things like how speed of application, system resources consumption. We will be installing Grafana on Brainy pi – Raspberry pi Alternative .
The Brainy Pi is a small and affordable computer/edge hardware that can run many different apps, including Grafana.
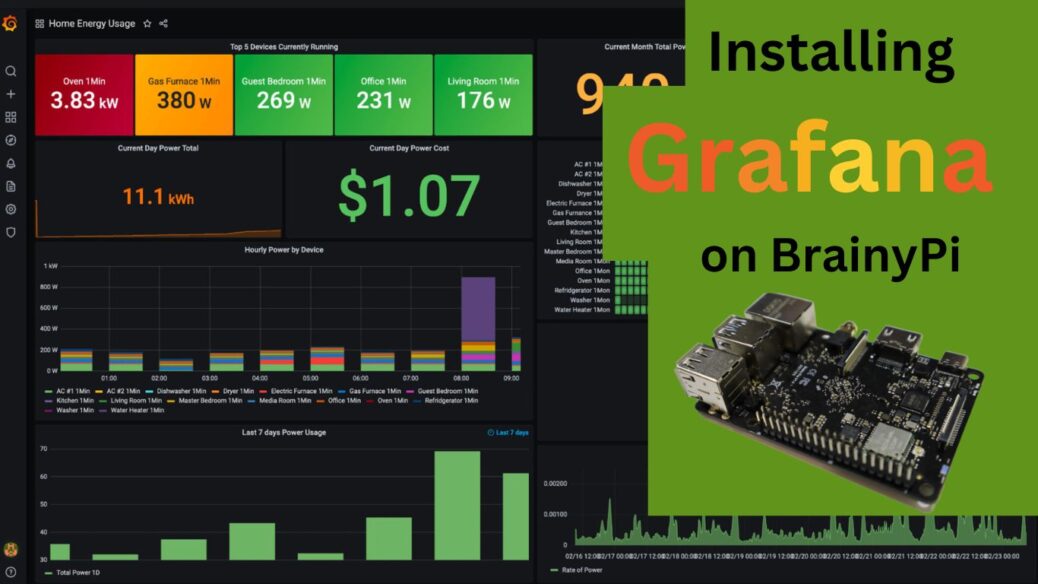
The purpose of this blog is to describe Grafana Installation on Brainy so that one can keep an eye on their home’s conditions, such as temperature, humidity, and energy use. Continue reading the blog…..
Required Components to Install Grafana on Brainy pi:

You will need:

-
-
Brainy Pi
-
-
-
Ethernet/ WIFI
-
-
-
Keyboard and mouse for USB
-
-
-
SD card
-
Step 1: Upgrade Your System
Do you need assistance with the Brainy Pi operating system installation? If you are computer literate, the regular Pi installation tutorial should get you through.
To install any new software, updating and upgrading the device is essential.
Installed, start your Pi, then type the following in the Terminal
Step 2: Grafana Installation on Brainy pi
1. The Grafana package repository must be included to install them on the Brainy Pi.
2. Now, we can confidently add the repository to our Pi’s list of package sources.
3. We must do an update since we changed our package list.
4. Next, execute the following command to install the most recent version on your device.
5. We must activate Grafana before running the appropriate instructions to launch it.
Step 3: Grafana Web Interface on Brainy pi
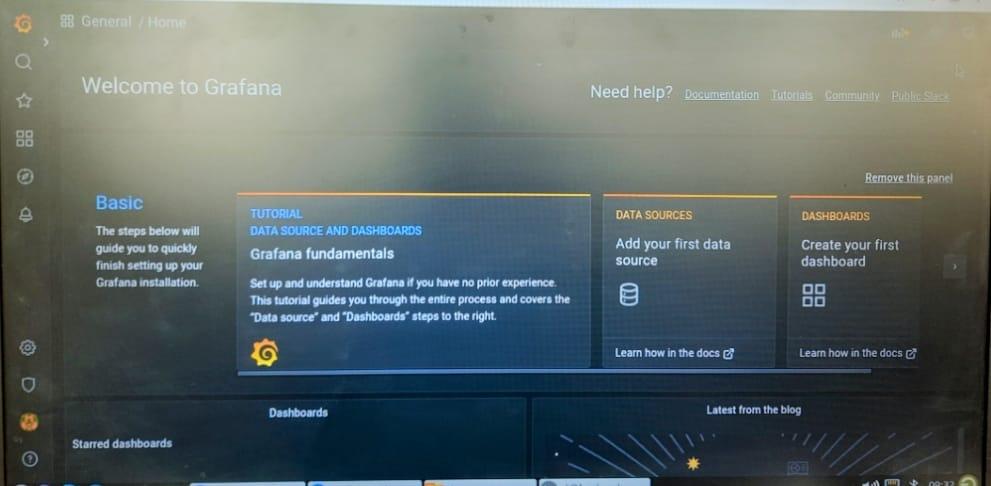
 When you initially launch Grafana, a login screen will appear.


